Vital Statistics
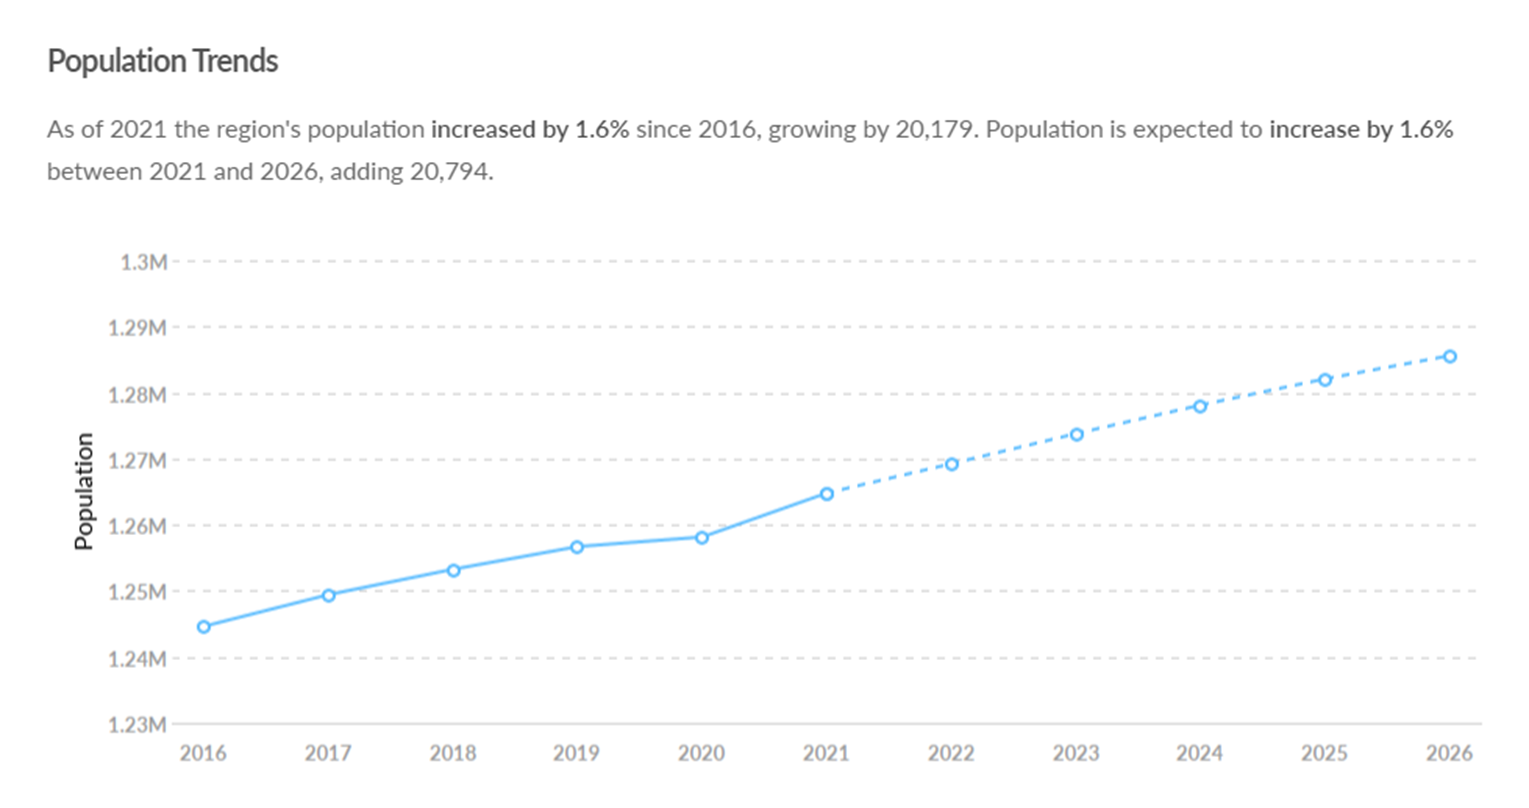
Population Trends
As of 2021 the region's population increased by 1.6% since 2016, growing by 20,179. Population is expected to increase by 1.6% between 2021 and 2026, adding 20,794.

Job Trends
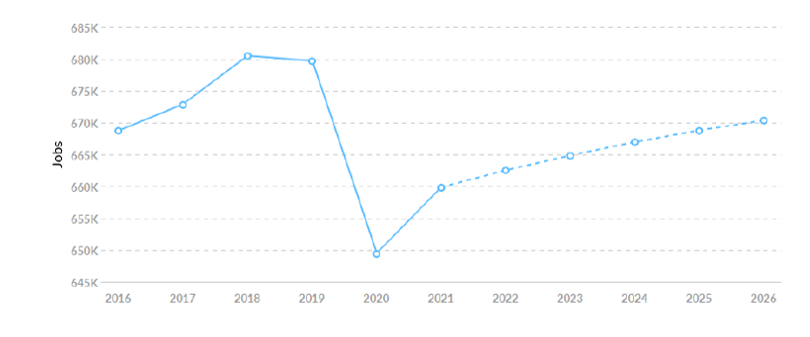
From 2016 to 2021, jobs declined by 1.3% in the New North region from 668,749 to 659,863. This change fell short of the national growth rate of 1.8% by 3.1%.
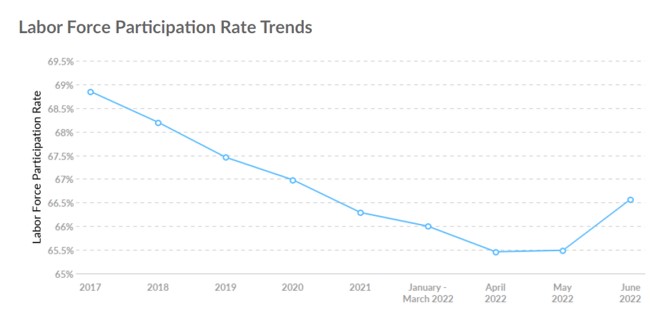
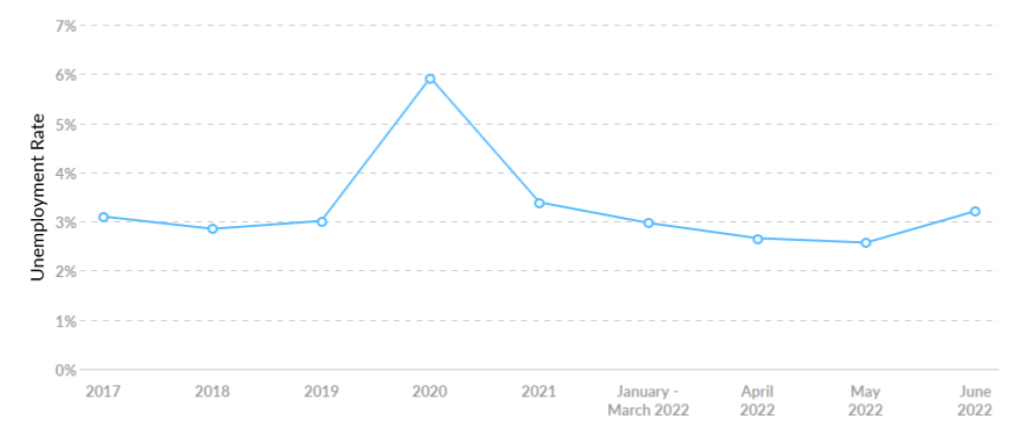
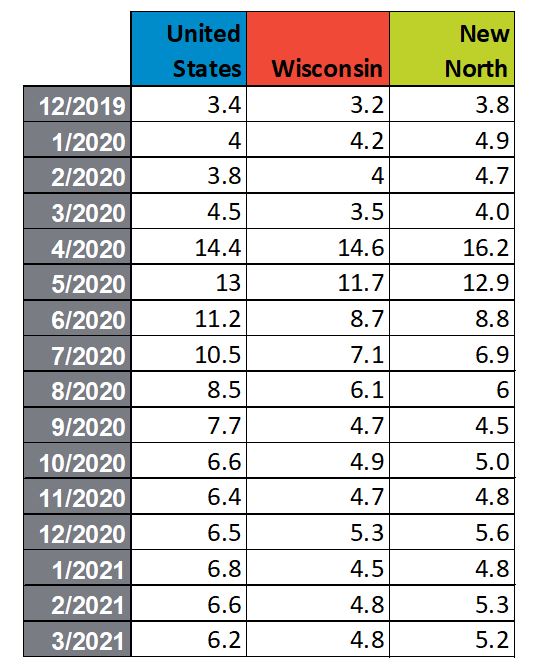
Unemployment Rate Trends
New North had an June 2022 unemployment rate of 3.21%, increasing from 3.10% 5 years before.
National Data
Real Gross Domestic Product
(Based on 2012 Dollars to adjust for inflation)
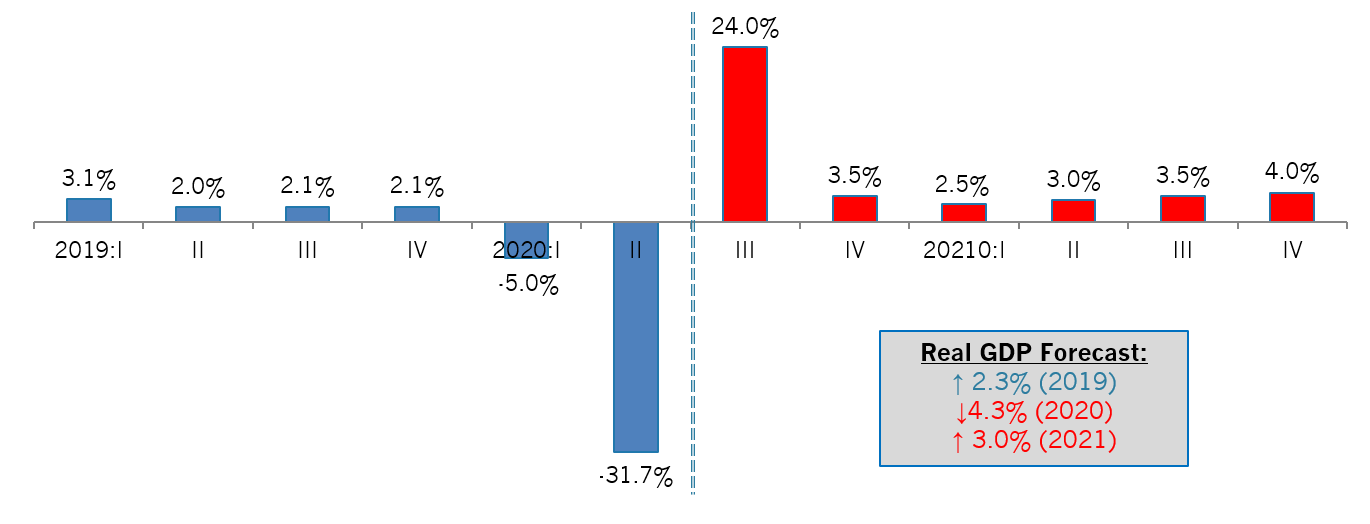
Source: Bureau of Economic Analysis, NAM calculations using Moody’s Analytics simulation model
Contributions to Percentage Change in Second Quarter
2020 Real GDP Growth
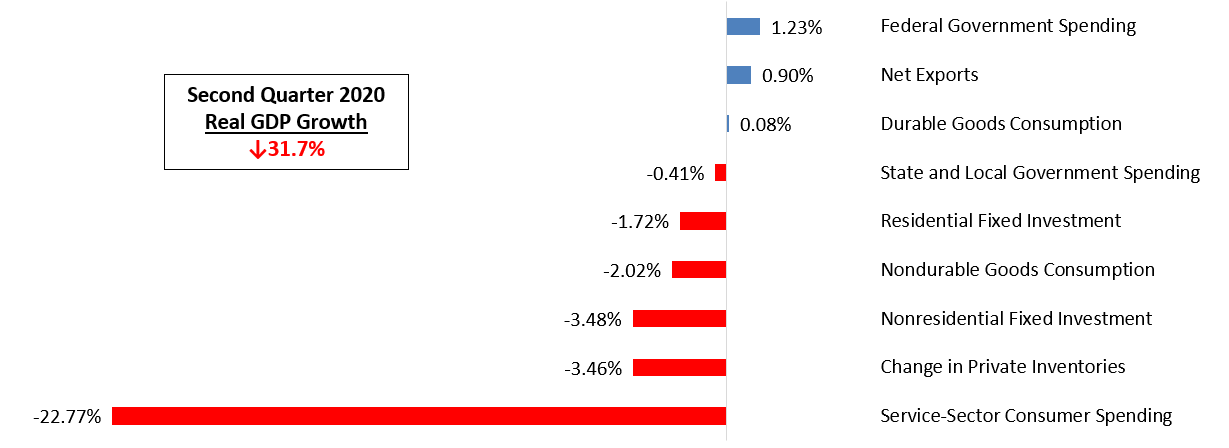
Source: Bureau of Economic Analysis
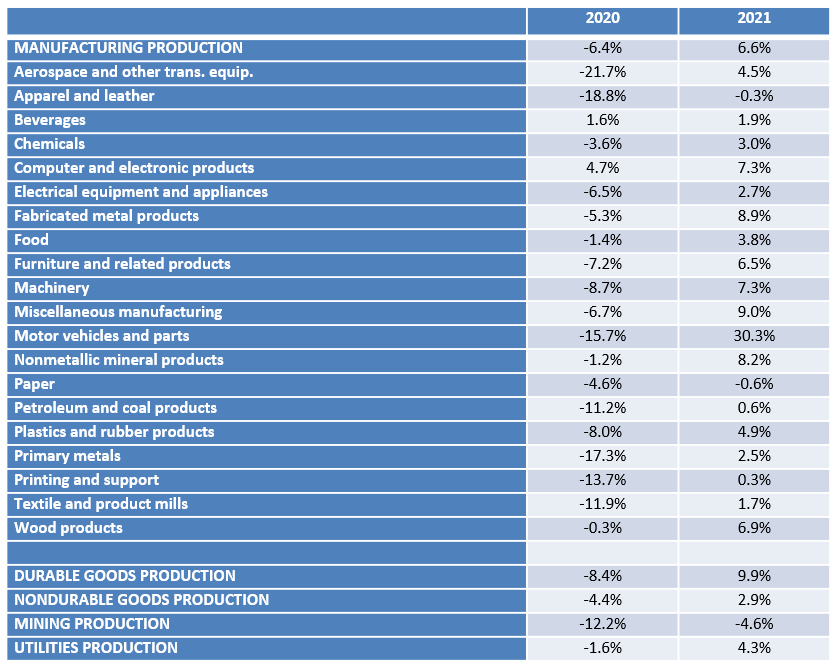
Actual and Predicted Manufacturing Production Growth
(NAICS, 2012=100)
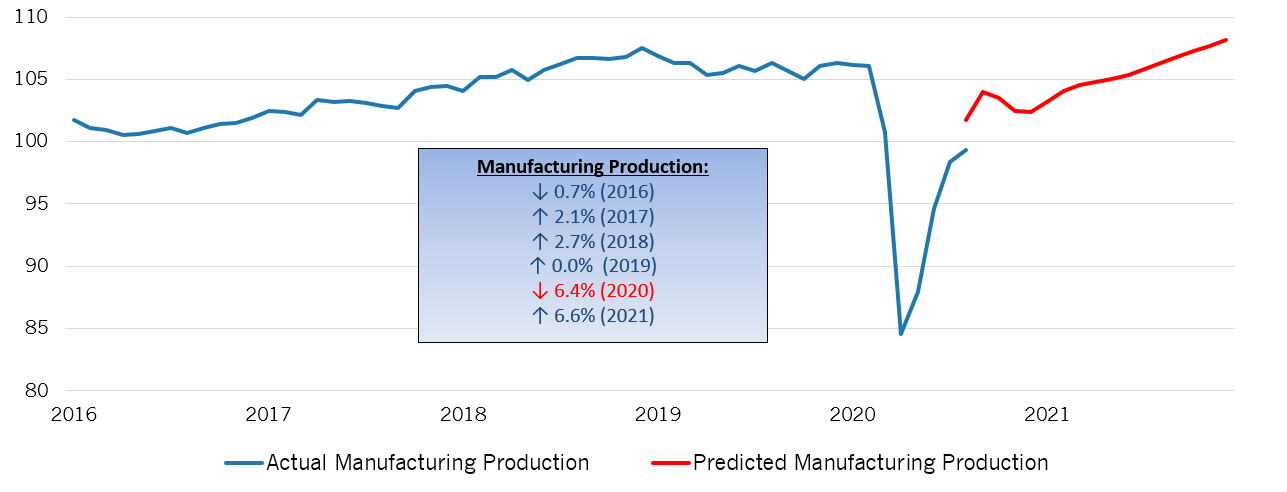
Source: Federal Reserve Board, NAM calculations using Moody’s Analytics simulation model
Moody’s Analytics Economic Model, August 2020 Baseline
Real Nonresidential Fixed Investment, Actual and Forecast, 2016-2022
(in Billions of Chained 2012 Dollars, Seasonally Adjusted at Annual Rates)
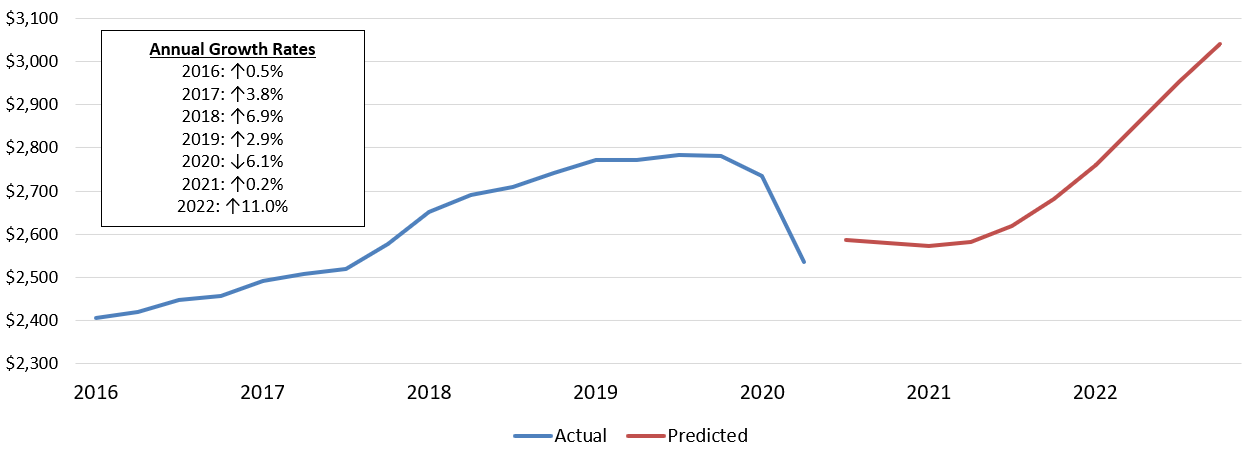
Source: Bureau of Economic Analysis, NAM calculations using Moody’s Analytics simulation model
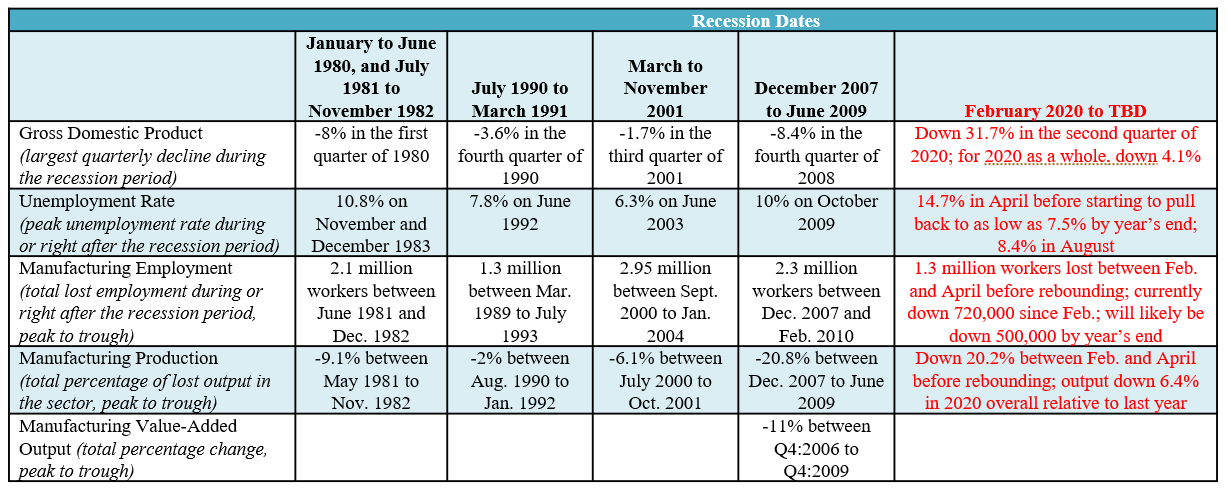
Recession Dates